You signed in with another tab or window. Reload to refresh your session.You signed out in another tab or window. Reload to refresh your session.You switched accounts on another tab or window. Reload to refresh your session.Dismiss alert
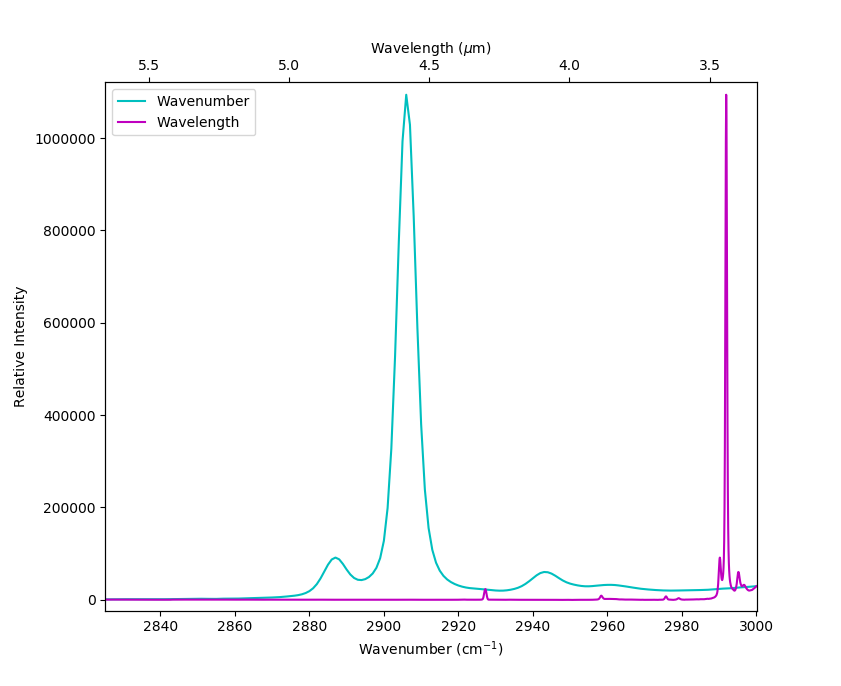
For a type of plot I will be doing quite often in the near future, it would be very helpful to have a secondary x axis on top of the plot featuring "inverse" (1/x) tick scaling. Basically like this stack overflow discusstion for the case of Python. https://stackoverflow.com/questions/56418477/displaying-wavenumber-and-wavelength-on-one-plot
This coule be achieved easily via twiny(), if there was an option :inverse for the axis scale. Currently available are only:
[:identity, :ln, :log2, :log10, :asinh, :sqrt]
Since Plots.jl is a "meta" package, at this point I do not quite understand if this would have to be done in Plots itself, or at the interfaces to all backends. I would appreciate if someone could implement this if it is not too much effort, or point me to what I would have to modify to do it myself.
Cheers
The text was updated successfully, but these errors were encountered:
Hi,
For a type of plot I will be doing quite often in the near future, it would be very helpful to have a secondary x axis on top of the plot featuring "inverse" (1/x) tick scaling. Basically like this stack overflow discusstion for the case of Python.

https://stackoverflow.com/questions/56418477/displaying-wavenumber-and-wavelength-on-one-plot
This coule be achieved easily via twiny(), if there was an option :inverse for the axis scale. Currently available are only:
[:identity, :ln, :log2, :log10, :asinh, :sqrt]
Since Plots.jl is a "meta" package, at this point I do not quite understand if this would have to be done in Plots itself, or at the interfaces to all backends. I would appreciate if someone could implement this if it is not too much effort, or point me to what I would have to modify to do it myself.
Cheers
The text was updated successfully, but these errors were encountered: