-
Notifications
You must be signed in to change notification settings - Fork 0
/
index.Rpres
140 lines (100 loc) · 2.74 KB
/
index.Rpres
1
2
3
4
5
6
7
8
9
10
11
12
13
14
15
16
17
18
19
20
21
22
23
24
25
26
27
28
29
30
31
32
33
34
35
36
37
38
39
40
41
42
43
44
45
46
47
48
49
50
51
52
53
54
55
56
57
58
59
60
61
62
63
64
65
66
67
68
69
70
71
72
73
74
75
76
77
78
79
80
81
82
83
84
85
86
87
88
89
90
91
92
93
94
95
96
97
98
99
100
101
102
103
104
105
106
107
108
109
110
111
112
113
114
115
116
117
118
119
120
121
122
123
124
125
126
127
128
129
130
131
132
133
134
135
136
137
138
139
140
R入門いろはにほへと: インストールから簡単な操作まで
========================================================
author: 瓜生真也(横浜国立大学大学院環境情報学府)
date: June 30, 2014
font-family: 'Helvetica'
autosize: true
css: custom.css
```{r, global_option, include=FALSE}
library(knitr)
opts_chunk$set(
warning=FALSE,
message=FALSE)
```
CONTENTS
=====
1. Rの概要
2. Rのインストール
3. 簡単な操作
4. RStudioのインストール
Rの概要
========================================================
<img src="https://raw.githubusercontent.com/uribo/rep-res-guideline/master/src/r-logo.png" widht="30" align="right"/>
多くの研究分野で使用される統計解析環境ソフト
* **オープンソース**なので、どういう機能を持っているのかがわかりやすい
* **フリーソフトウェア**。他の統計解析ソフトの多くが高価
* **パッケージ**と呼ばれる拡張機能により、多くの機能を増やせる
Rのインストール
=====
### -> [CRAN](http://cran.r-project.org)
Downlaod R for **Linux/Mac/Win**
Windowsの場合...

Rスクリプトの書き方
=====
```{r}
1 + 3
```
```{r}
a <- c(1, 2, 3)
a
```
```{r}
b <- c(4, 5, 6)
a + b
```
```{r}
a * b
```
Rスクリプトの書き方
=====
```{r}
mean(b)
```
```{r}
10 * pi
```
Andersonのアヤメのデータを使った例
======
> 三種類のあやめの品種のそれぞれからの50の花の蕚(がく)片の長さと幅、花弁の長さと幅
```{r}
data(iris)
head(iris)
```
Fisherのアヤメのデータを使った例
======
#### 図を描く
```{r, ex_iris_plot, eval=FALSE}
plot(
iris$Sepal.Length, iris$Petal.Length,
col=c("royal blue", "green", "orange")[iris$Species],
pch=16, cex=2)
```

関数とパッケージ
=====
一元配置分散分析... `oneway.test()`
> 3種の萼片の長さの平均値に差があるか
```{r}
oneway.test(iris$Sepal.Length ~ iris$Specie)
```
> P < 0.001で萼片の長さの平均値には3種間で差がある
関数とパッケージ
=====
```{r, eval=FALSE}
install.package("lattice", dependencies=TRUE)
```
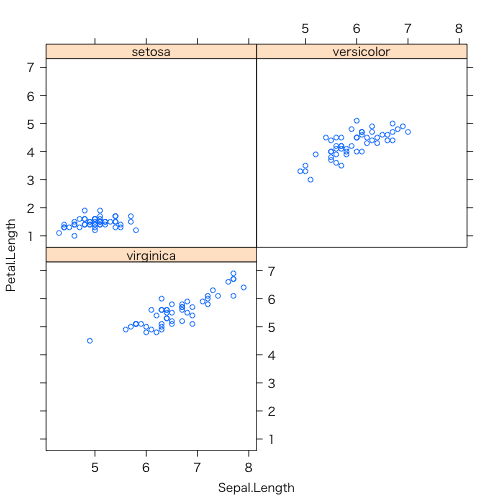
```{r ex_iris_xyplot, eval=FALSE}
library(lattice)
xyplot(
Petal.Length ~ Sepal.Length | Species,
data=iris)
```

RStudioのインストール
=====
http://www.rstudio.com

RStudioのインストール
=====
