-
Notifications
You must be signed in to change notification settings - Fork 0
Home
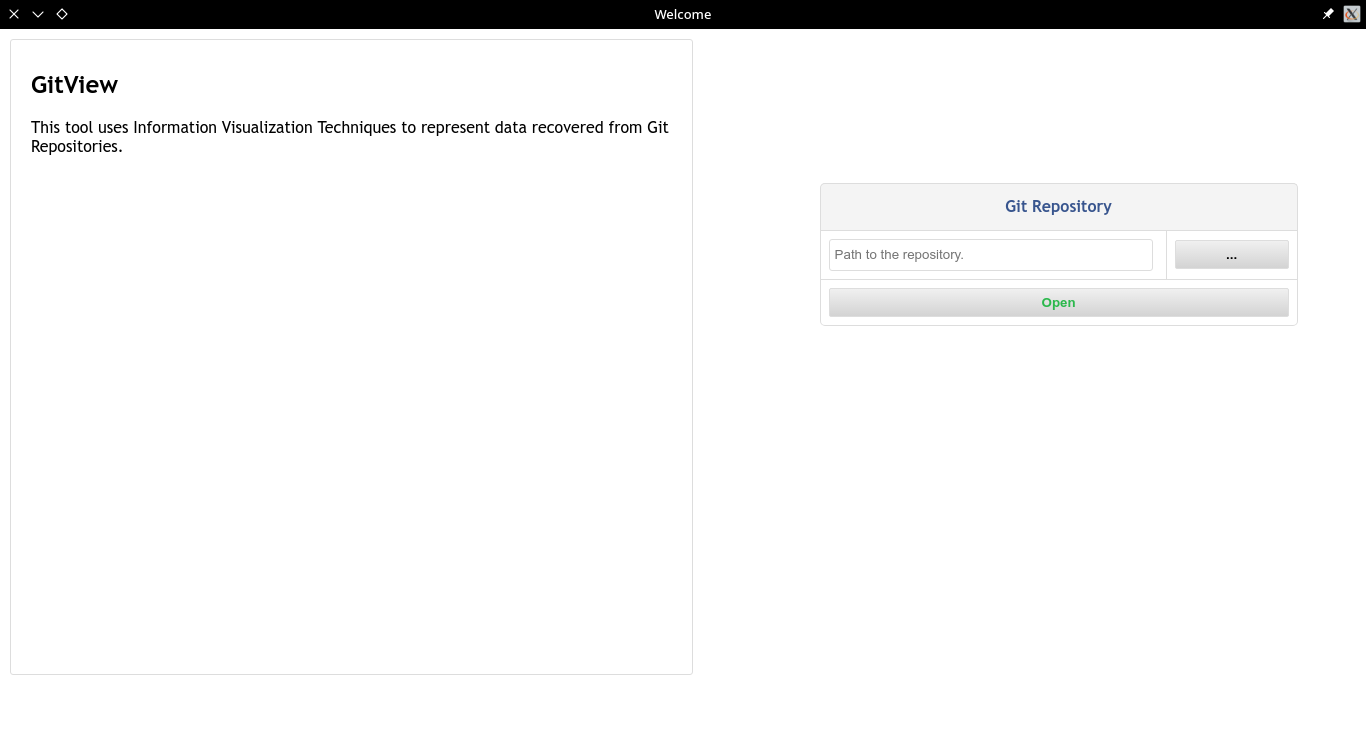
Below is an image of the first screen of the tool:

To open a repository, you can type the full path in the text field or browse to the repository directory by clicking the [...] button.
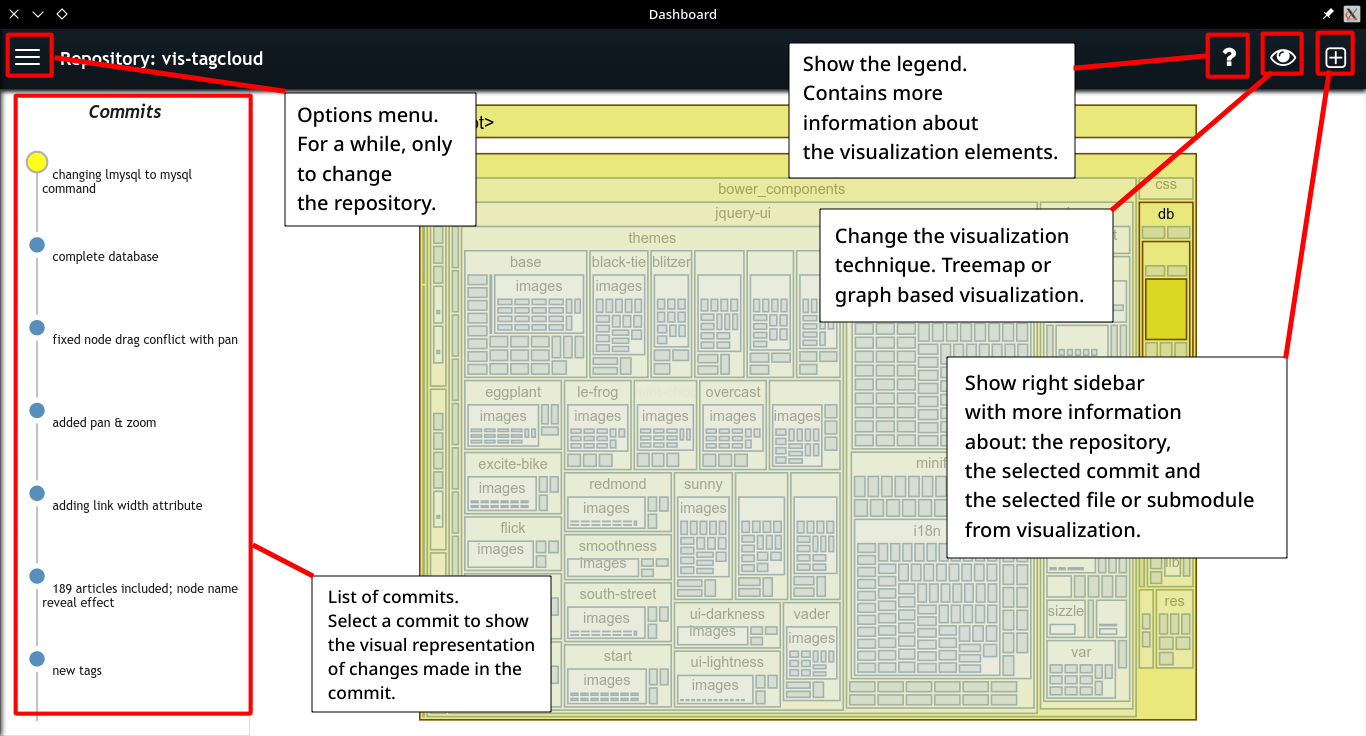
After opening the repository, the data recovered from the repository is processed to create the view. The figure below shows the main elements of the interface:

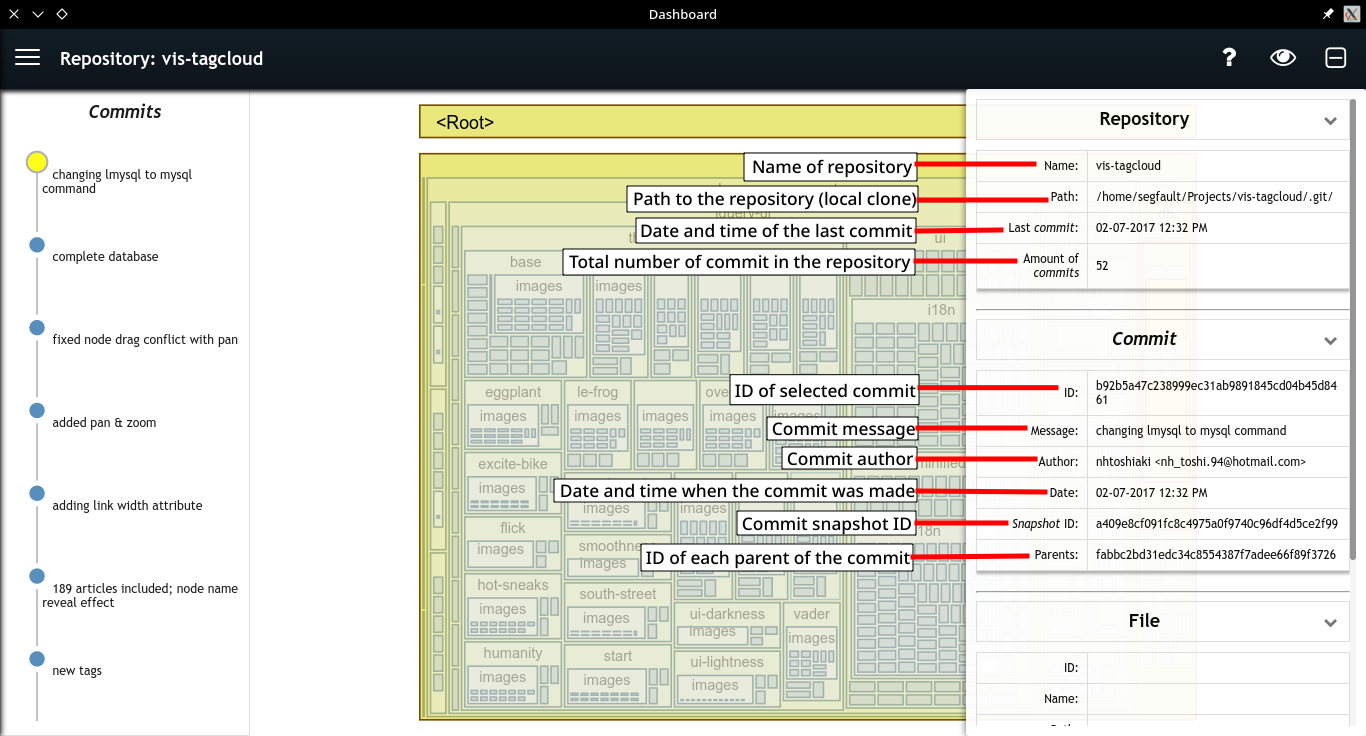
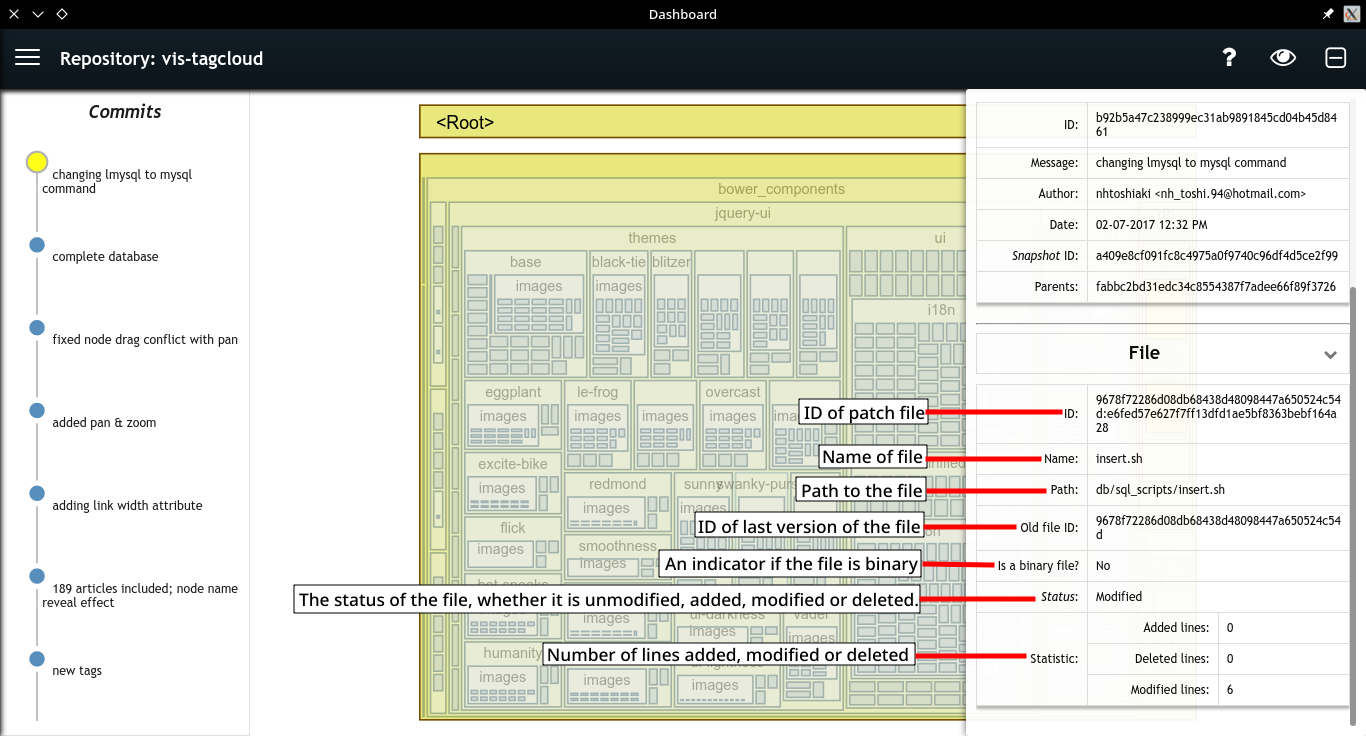
By clicking on the top right plus button the right panel will be shown with more information as described in the pictures below:


A file may be in one of the following states:
- Unmodified: No changes were made;
- Added: The file is new in the repository;
- Modified: The content of the file has been modified;
- Moved: The file has been renamed or moved to another directory
- Deleted: The file no longer exists in the repository.
A non-binary modified file may also have lines in the following states:
- Unmodified: As the name says, a line that was not changed;
- Added: A new line in the file;
- Modified: The new line that replaces the position of a deleted line;
- Deleted: A line that no longer exists in the file.
A statistic of the number of added, modified and deleted lines is counted for each modified file.
For each selected commit, two visual representations of changes made in the commit are created: a treemap and a graph-based view.
| Treemap | Graph-based View |
|---|---|
 |
 |
Some visual characteristics are used to represent the status of each file and directory. Being them:
- The color;
- the opacity; and
- the size.
The colors are used to represent the status of a file or directory. Each status is represent by a color as ilustrated below:
| Treemap Legend | Graph-based View Legend |
|---|---|
 |
 |
The above legends are also available by clicking the ? button of the interface.
In addition to color, the opacity is also used to highlight changed files or directories. See an example in the figure below.
| On the Treemap | On the Graph-based view |
|---|---|
 |
 |
All unmodified files and directories have a reduced opacity to highlight changed files and directories. In case of the treemap, as a treemap consist of overlapping rectangles, the reduced opacity creates a gradient from the root directory to unmodified files.
The size is used to represent the amount of changes made to a file or directory.
For each node a sum of all aditions, modifications and deletions is used to define your weight. The weight of each directory is propagated throughout the directory hierarchy, i.e., each directory has a weight corresponding to the sum of its weight with the weights of all its children.
Then a square root scale is used to calculate the size of the node based on your weight.
See the figures below for examples of nodes with different sizes.
| On the Treemap | On the Graph-based view |
|---|---|
 |
 |
Its important to note the difference in the calculation of the weight of a directory and the weight of a file. For directories the amount of additions, modifications and deletions are from files and for files are from lines.