-
Notifications
You must be signed in to change notification settings - Fork 2
Output Framework
Sayan Sil edited this page Oct 13, 2020
·
5 revisions
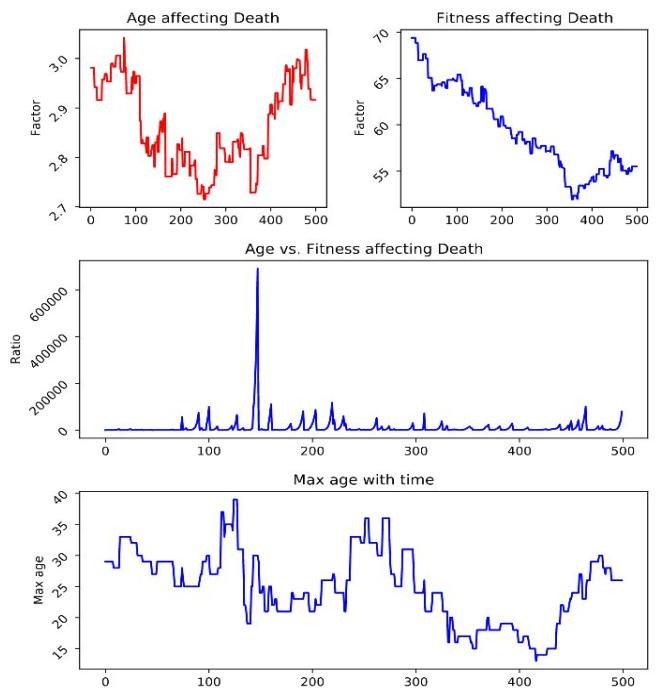
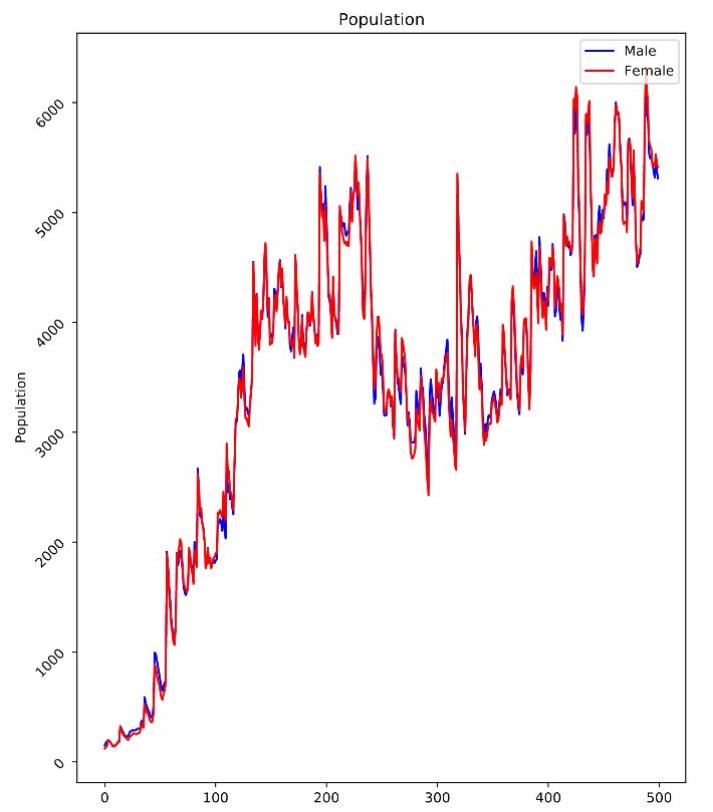
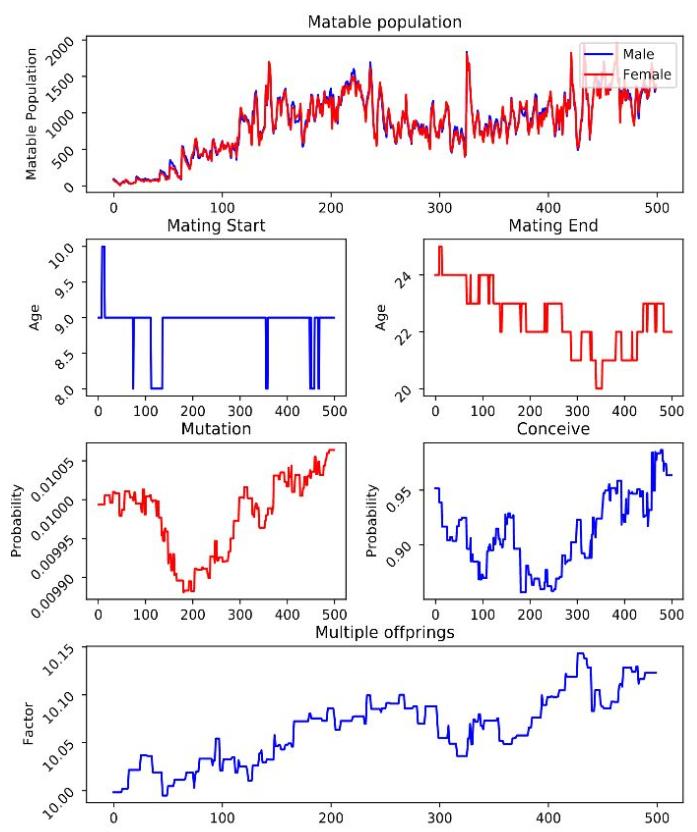
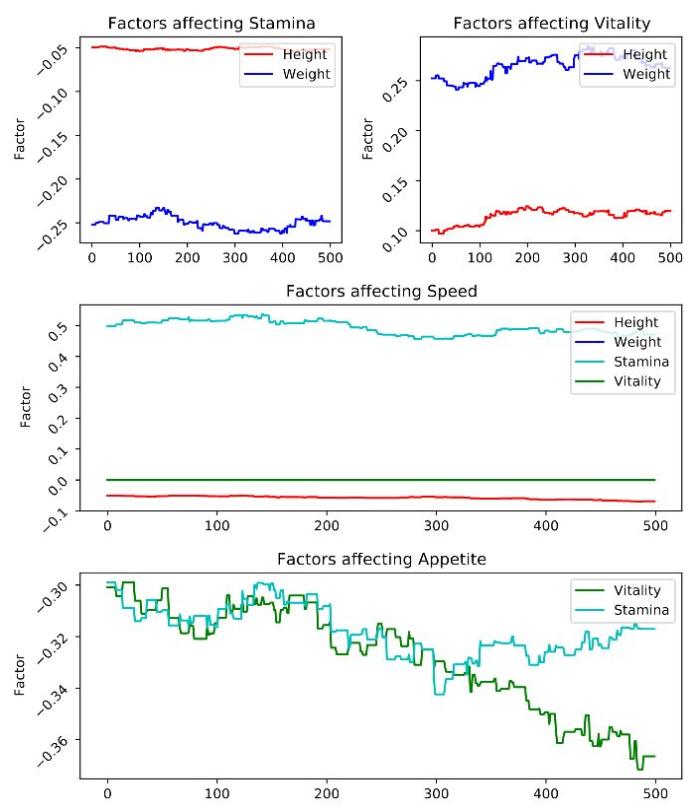
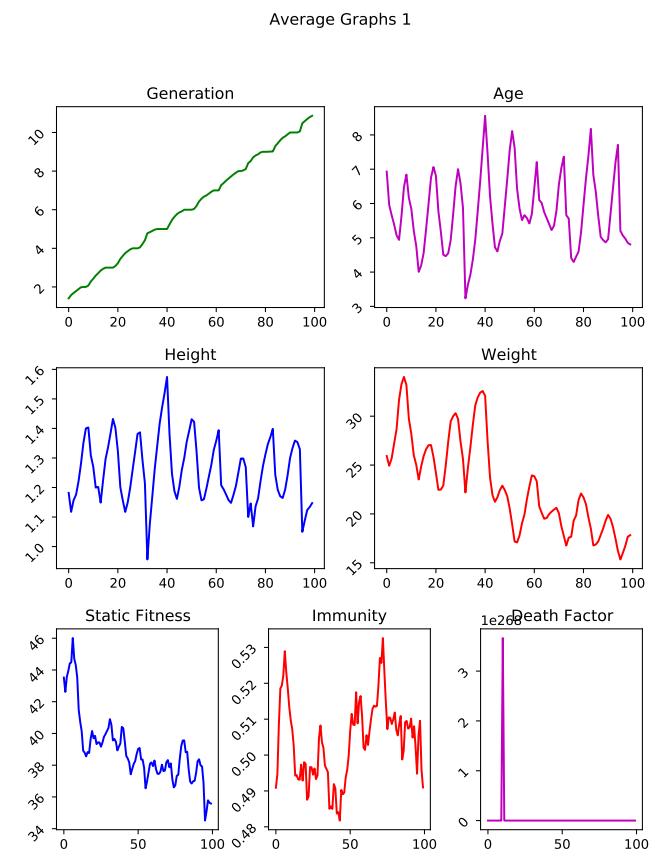
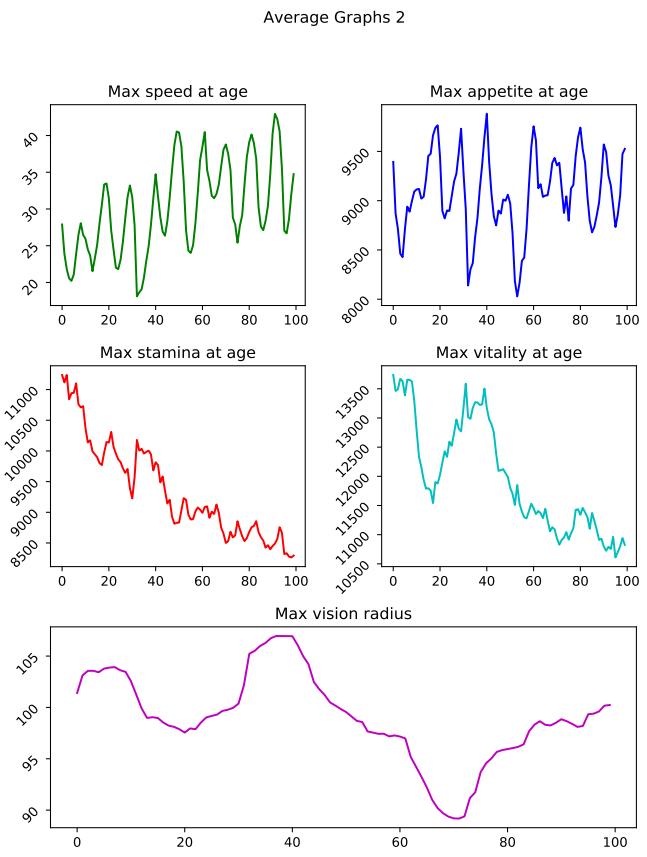
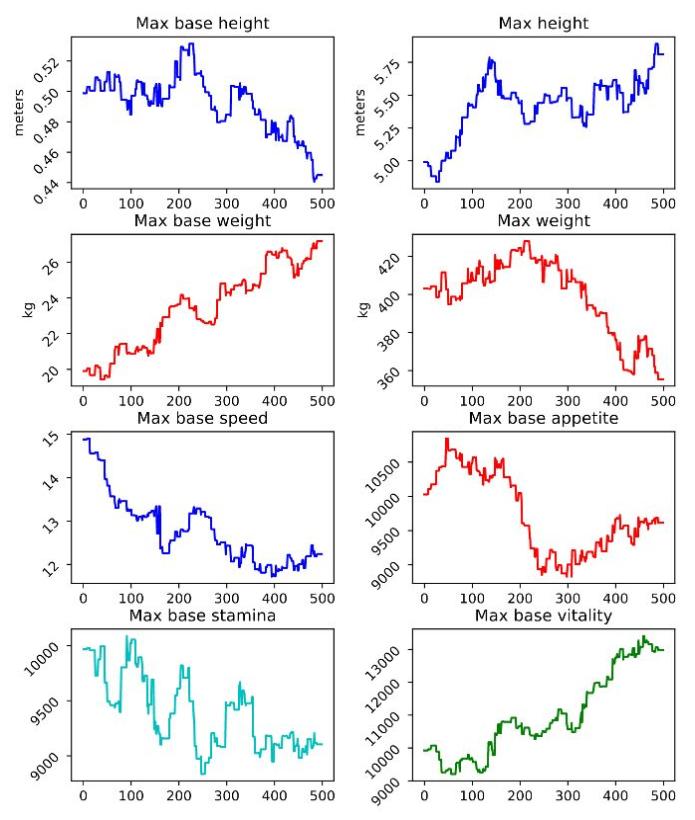
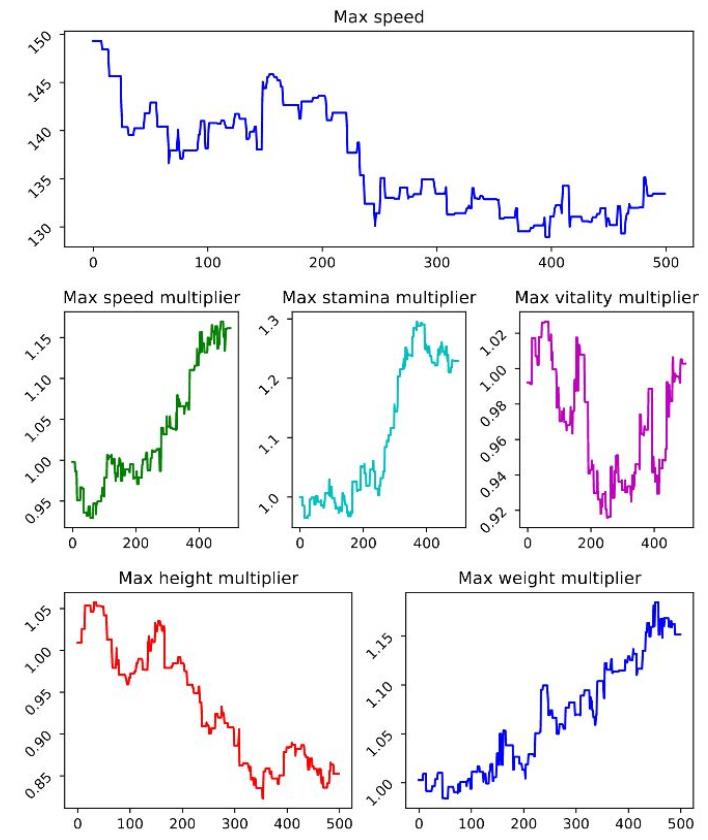
The simulation outputs are organized into a single PDF document consisting of plots showing annual trends in their traits along with their statistical analysis and interdependence of multiple traits against/for a common cause.
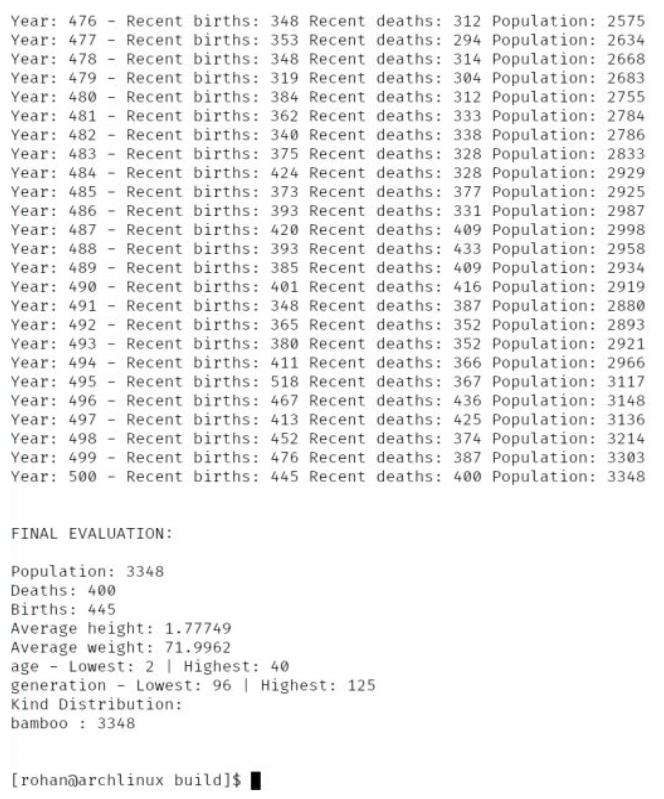
Contains the systematic prints for the annual statistics for the organisms present in the simulation. The picture below shows a snapshot of the console log of the annual births and deaths for a Plant species by the name bamboo.
🏠 About | 🔌 Setup | 🔩 Framework | 💻 Code
